DroughtObserve
Near-real-time drought monitoring for Africa and MENA using FAO WaPOR datasets
Background
The WaterPIP Project has developed a drought monitoring system using the FAO WaPOR datasets and machine learning, named DroughtObserve. It offers maps of drought intensities at two administrative levels over Africa and MENA region as well as timeseries of historical drought (2009 - near real time). The tool also contains a 6-month forecast of the drought intensity.
Approach
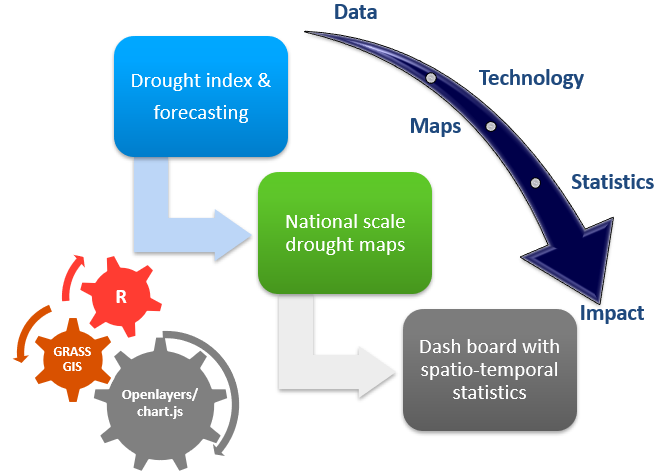
The methodology used to create DroughtObserve has two major steps – i) preparation of Standardized Precipitation Actual Evapotranspiration Index (SPAEI) from long term monthly water surplus/deficit (Precipitation – Reference Evapotranspiration) data ii) applying an auto-regressive model to predict for future months. DroughtObserve uses data from FAO WaPOR database to compute drought index over the cropped areas.
Outputs
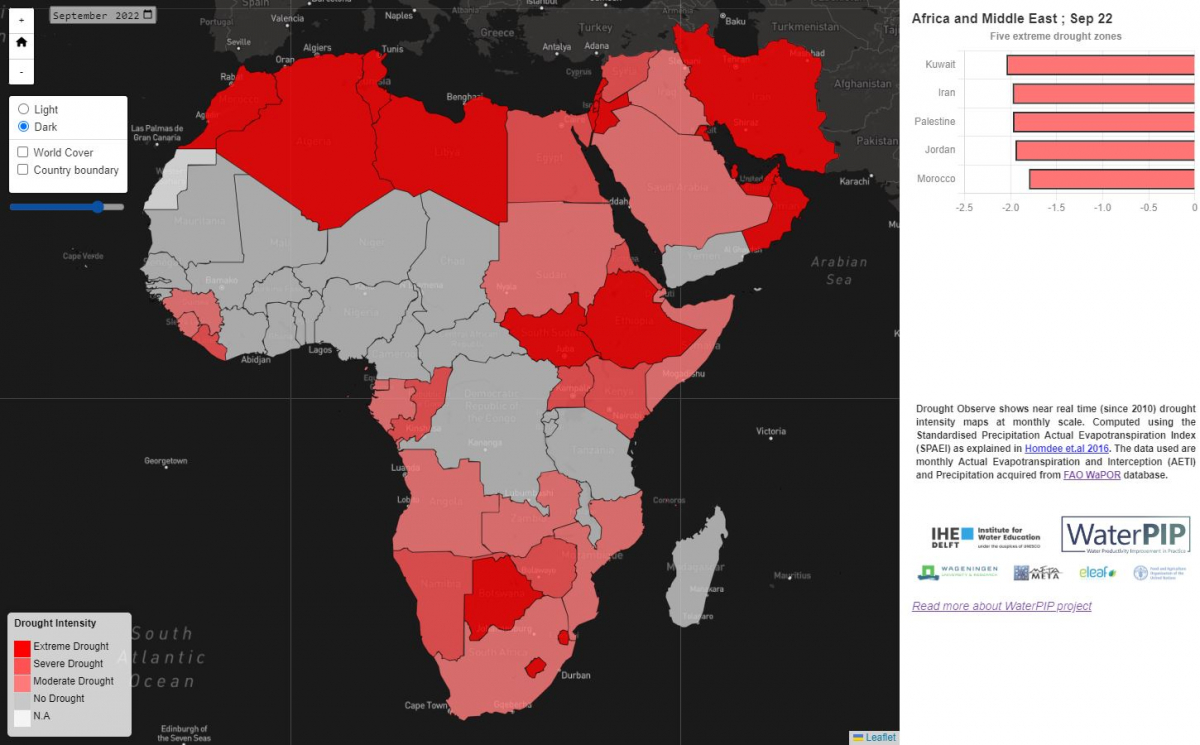
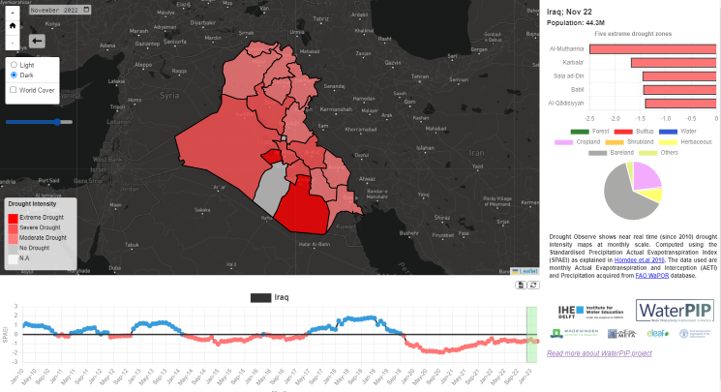
The landing page of the dashboard shows the country level drought status since January 2010. It is also possible to zoom into individual countries and see at sub-national level the drought status. The five most drought affected regions are listed on the right hand side. Below the map the timeseries of SPAEI for the region is shown, including the six-month forecast (highlighted in green).
A 1-page flyer can be found here
Updated website link: https://wateraccounting.github.io/droughtobserve/
Preview: