WaterPIP Tools
Here you can find all the tools and publications developed by the WaterPIP Project Team. Feel free to have a look around and apply them in your own case studies!
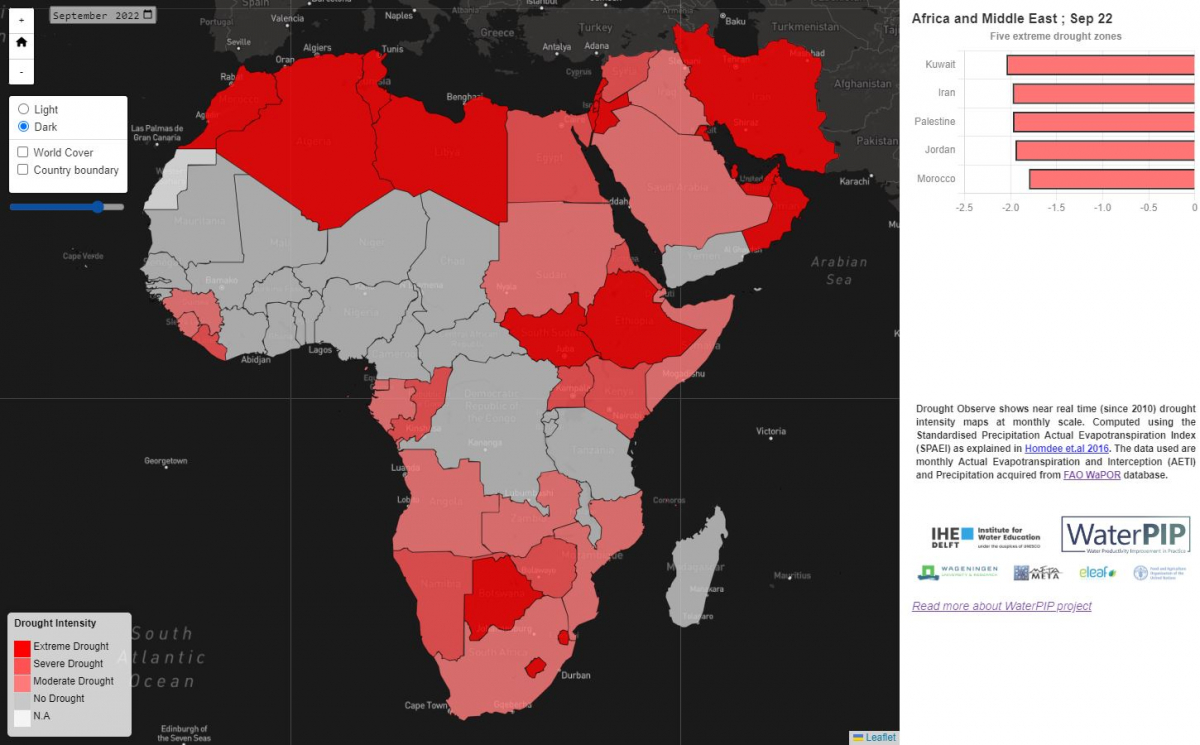
This interactive dashboard provides near-real-time drought monitoring for Africa and MENA region using FAO WaPOR datasets. More information can be found here or read the summary on our 1-page flyer.
WaPORACT is an open-access tools to extract, interpret, analyse and visualize geodata to improve water productivity. WaPORACT supports the development of customized geodata services in Africa and the Near East. It is a suite of Python tools to retrieve, aggregate, analyze, visualize and disseminate FAO WaPOR water productivity data. The complete toolbox is available open-access at Github and provides the building blocks for customized tool development to target specific user needs.
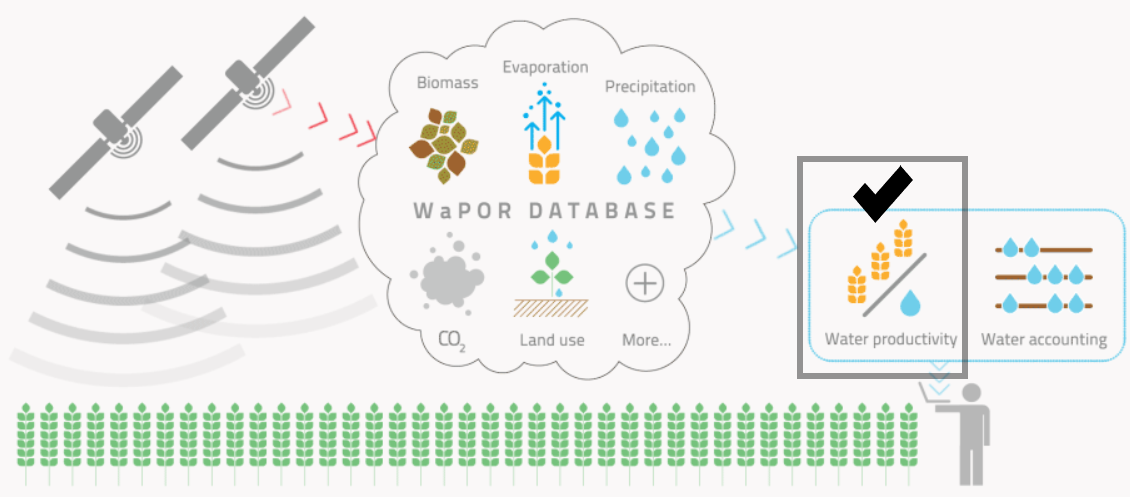
Standardized Protocol for Land and Water Productivity Analyses using WaPOR
This standardized protocol provides Python scripts which can be used to calculate land and water productivity and other performance indicators such as uniformity, efficiency (beneficial fraction), adequacy, relative water deficit as well as estimating productivity gaps. Go to the Github repository to view and download the Jupyter Notebooks with the protocol.
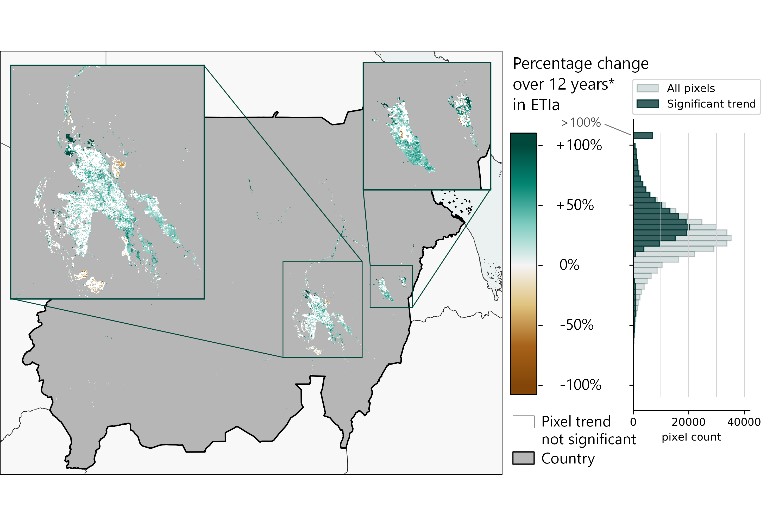
Change in agricultural indicators 2009-2020
This web-based application provides the average value of six agricultural indicators over the period 2009-2020 and the percentage change over the period based on WaPOR data. You can find the web-based application here.
Developed by one of the WaterPIP hackathon winners! The water accounting and productivity plugin for QGIS platform provides access to all the WaPOR data and includes it in the QGIS canvas as another raster layer, providing WaPOR data easy access to the QGIS users. Moreover, the water accounting and productivity component of the plugin will help the water management, providing the opportunity of calculating water accounting indicators, through the creation of maps and reports.
